Last week I had to create a visualisation for organization entity chart. The complexity was that an entity can be created by merging of two entities. So, I was looking for a solution that gives the flexibility to have two parent nodes. I started with D3.js but quickly figured out that tree charts in D3.js can’t have two parent nodes. After a lot of googling and trying many different libraries I decided to create that using Graphviz. The only problem was that I wanted to do it on the client side.
Below is the chart that I wanted to create. As you can see below – Dummy Org ABC Limited has two parents Dummy Org India Ltd and Dummy Org East Africa DMCC. Similarly, Dummy Org Devs Project has two parents Dummy Org Infrastructure Limited and Dummy Org Infrastructure & Dummy Org Project
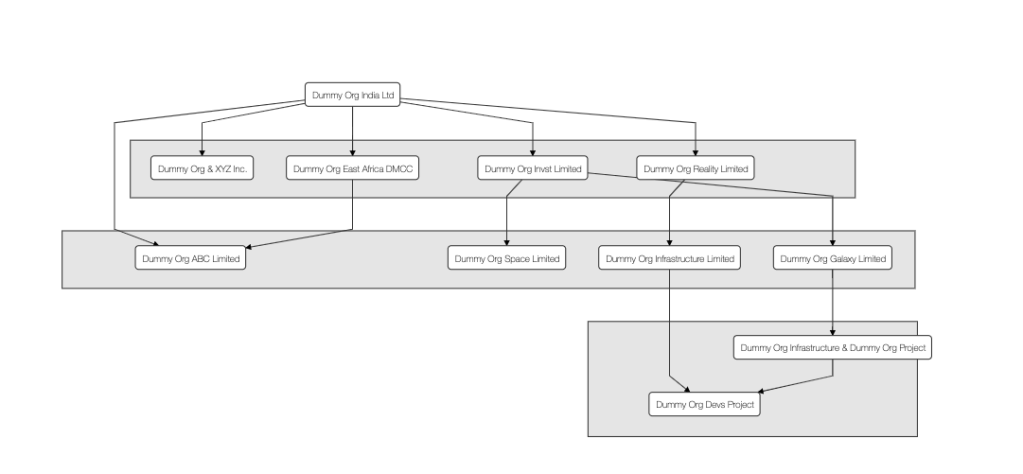
Using graphviz dot syntax the above can be created a shown below.
digraph ORG {

  node [rx=5 ry=5 labelStyle="font: 300 14px 'Helvetica Neue', Helvetica"]

  { rank=same b1 c1 d1 e1 }
  { rank=same f1 g1 h1 i1 }
  { rank=same j1 k1 }

  a1     [ label = "Dummy Org India Ltd"  ]

  b1 [ label = "Dummy Org & XYZ Inc."]
  c1 [ label = "Dummy Org Invst Limited"]
  d1 [ label = "Dummy Org East Africa DMCC"]
  e1 [ label = "Dummy Org Reality Limited"]
  f1 [ label = "Dummy Org ABC Limited"]
  g1 [ label = "Dummy Org Space Limited"]
  h1 [ label = "Dummy Org Galaxy Limited"]
  i1 [ label = "Dummy Org Infrastructure Limited"]
  j1 [ label = "Dummy Org Infrastructure & Dummy Org Project"]
  k1 [ label = "Dummy Org Devs Project"]


  a1 -> b1;
  a1 -> c1;
  a1 -> d1;
  a1 -> e1;

  c1 -> g1;
  c1 -> h1;

  a1 -> f1;
  d1 -> f1

  e1 -> i1;

  i1 -> k1;

  h1 -> j1;

  j1 -> k1;

}
The above will create a directed graph. If you are using Mac then installing graphviz is as simple as brew install graphviz.
As mentioned before I wanted to on the client side so I was looking at a Javascript library that can do that at the client side. I found dagre-d3 that can do the job for me.
You first have to add following libraries to your HTML page.
<script src="https://d3js.org/d3.v4.js"></script>
<script src="https://dagrejs.github.io/project/graphlib-dot/v0.6.3/graphlib-dot.js"></script>
<script src="https://dagrejs.github.io/project/dagre-d3/latest/dagre-d3.min.js"></script>
Once you have done that you will create a textarea for dot graph text and define an SVG element where you want to render the chart.
<textarea id="inputGraph" rows="10" style="display: block">
 // dot graph goes here
 </textarea>

<h2>Graph Visualization</h2>

<svg width=1400 height=600>
  <g/>
</svg>
Finally, you will write the JavaScript that will read the Graphviz dot file and render into the SVG using dagre-d3.
var inputGraph = document.querySelector("#inputGraph");

// Set up zoom support
var svg = d3.select("svg"),
    inner = d3.select("svg g"),
    zoom = d3.zoom().on("zoom", function() {
      inner.attr("transform", d3.event.transform);
    });
svg.call(zoom);

// Create and configure the renderer
var render = dagreD3.render();

var g = graphlibDot.read(inputGraph.value);

d3.select("svg g").call(render, g);
The above will render the graph shown in the post.
Discover more from Shekhar Gulati
Subscribe to get the latest posts sent to your email.
