Updated: 3rd September 2020
A couple of weeks back I learnt about DuckDB while going over DB Weekly newsletter. It immediately caught my attention as I was able to quickly understand why need for such a database exist. Most developers are used to working with an embedded file based relational database in their local development environment. Most popular choice among embeddable RDBMS is SQLite. Developers use embeddable databases because there is no set up required and they can get started quickly in a couple of minutes. This enables quick prototyping and developers can quickly iterate on business features.
DuckDB is similar to SQLite in the sense it is also designed to be used as an embeddable database. Developers can easily include it as a library in their code and start using it. Later in this post, I will cover how we can use DuckDB with Python.
Why DuckDB?
SQLite is mainly focussed on transactional(OLTP) workloads. Its execution engine works on rows that are stored in the B-Tree storage format. On the other hand DuckDB is meant to be SQLite equivalent for analytical(OLAP) workloads. Below is the image that I took from SIGMOD 2019 paper[1] on DuckDB that clearly shows the gap DuckDB is trying to fill.

As shown in the image above, DuckDB fills the topmost right quadrant. It is an embeddable equivalent of OLAP databases like Teradata.
The database like DuckDB is meant to solve the real need in the data science community for a faster embedded analytics datastore.
Typical RDBMS like PostgreSQL have bad getting started experience for data scientists. Some of the problems are:
- Difficult to install
- Difficult to setup/maintain
- Slow data transfer to/from client
- Poor interface with client application
- Client server architecture
- Pointless for single-user use case
- Transfer efficiency is crucial
- SQL is not sufficient for data science
- Data scientists use R/Python packages
- Connectors not built for bulk transfer
- SQL as strings can lead to security issues
- SQL is not composable
DuckDB Features
DuckDB development started in July 2018. The main features of DuckDB are:
- Simple installation
- Embedded: no server management
- Single file storage format
- Fast analytical processing
- Fast transfer between R/Python and RDBMS
- Does not rely on any external state. For example, separate config files, environment variable.
- Single-File storage format
- Composable interface. Programmatic Fluent SQL API
- Fully ACID through MVCC

Difference between OLTP and OLAP
Before we move further it is important to understand the differences between OLTP and OLAP workloads.
OLTP stands for Online Transaction Processing System. Their main focus is to support user-facing transaction oriented applications. An example of OLTP system is an online grocery store.
OLAP stands for Online Analytical Processing system. Their main focus is to help business make better decisions. OLAP databases are typically used to analyse the data from more than one database. They are used for financial forecasting, reporting, etc.
| OLTP | OLAP |
|---|---|
| It is used to manage daily transactions. They helps run business seamless. | It is used for analysis over the data. They help predict future using data |
| The queries are short running typically less than second | The queries are complex and response time vary from few seconds to minutes to hours |
| OLTP tables are normalized | OLAP tables are de-normalized |
| OLTP is characterised by a large number of short online transactions (Insert, Update, Delete) | OLAP is characterised by relatively low volume of read only transactions. |
| OLTP databases are implemented as row-oriented | OLAP databases are usually implemented as column-oriented |
DuckDB is a columnar OLAP database
DuckDB is a column-oriented embeddable OLAP database.
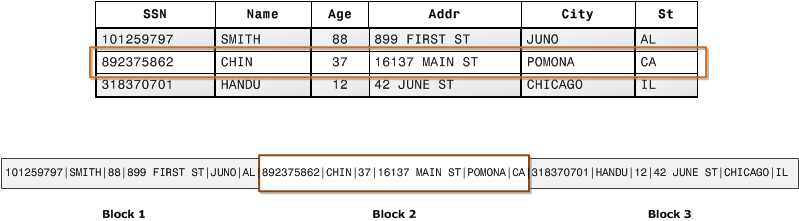
A typical OLTP relational database like SQLite is row-oriented. In row-oriented database, data is organised physically as consecutive tuples. It is once-a-tuple processing model. Below is the diagram that shows how how records from database tables are typically stored into disk blocks by row. I took this diagram from AWS Redshift documentation[2].
On the other hand, a columnar database are organised by field, keeping all the data associated with a field next to each other. This property of columnar database is useful for OLAP workload. Most OLAP queries typically access only subset of the column but a large number of rows for those columns. Below is the diagram that shows how with columnar storage, the values for each column are stored sequentially into disk blocks.

DuckDB make use of two more optimisations:
- DuckDB uses vectorized data processing which helps develop faster analytical engines by making efficient utilisation of CPU cache. The main idea behind vectorized processing is to work on columns (or columnar data) and defer the materialization of values from multiple columns into tuples (or rows) till very late in the query plan — mostly when we need to project the resultset back to user.
- DuckDB uses Multi-version concurrency control to become ACID compliant.
DuckDB use cases
There are two important use cases for DuckDB as cited in the SIGMOD 2019 paper[1]:
- Interactive data analysis: Many organisations are leveraging data scientists to make sense of the data so that they can take better business decisions. Today, the most popular way data scientists explore the data on their local environments is by writing Python or R code using libraries like Pandas, dplyr, etc. DuckDB gives another alternative to data scientists who want to use SQL for their local development work. SQLite does not shine here because it is slow for OLAP workloads and it does not have all the functions required for data analytics work.
- Edge computing: This use case is becoming popular with the rise of edge computing in the last couple of years. Edge computing is a distributed computing paradigm which brings computation and data storage closer to the location where it is needed, to improve response times and save bandwidth. With embeddable database like DuckDB data can be analysed on the edge giving better results faster.
DuckDB in Action with Python
The first thing you need to is to install duckdb library using pip
pip install duckdb
Now, we will write code to load data from CSV into a table. I am using a dummy sales data that I downloaded from this link.
import duckdb
conn = duckdb.connect('sales.duckdb')
cursor = conn.cursor()

cursor.execute("""
CREATE TABLE sales(
   Transaction_date date
  ,Product          varchar
  ,Price            bigint
  ,Payment_Type     varchar
  ,Name             varchar
  ,City             varchar
  ,State            varchar
  ,Country          varchar
  ,Account_Created  varchar
  ,Last_Login       varchar
  ,Latitude         double
  ,Longitude        double
)
"""
)

cursor.execute("COPY sales FROM 'sales.csv' (HEADER)")

print(cursor.execute('select count(*) from sales').fetchall())
cursor.close()
conn.close()
In the code snippet shown above, we connected to database and executed few queries. First, we created a sales table, them we copied data from CSV file into the table, and finally we made a count query.
If you run this script, you will see output as shown below.
(venv) ➜  duckdb python app.py
[[998]]
The sales.csv has 998 records.
We can execute group by queries as well.
query = "select city, sum(price) from sales group by city"
print(cursor.execute(query).fetchdf())
The above will return a data frame as shown below.
                             city  sum(price)
0                   Prince Albert        3600
1                       Kobenhavn        1200
2                      Belleville        1200
3                          Aardal        1200
4                        Den Haag       19500
..                            ...         ...
754              Fort Saint James        1200
755                      Mettlach        1200
756                        Bergen        2400
757  Billings                            1200
758  Norcross                            1200

[759 rows x 2 columns]
We can also execute aggregation queries like shown below.
SELECT MIN(cnt), AVG(cnt),MAX(cnt) FROM
    (select count(*) as cnt FROM sales
    GROUP BY EXTRACT(DOY FROM Transaction_date::DATE),
    EXTRACT(HOUR FROM Transaction_date)
    ) stats
Conclusion
DuckDB is an interesting database from CWI Database Architectures Group. It solves a pain area that developers in data analytics face. I think it is a useful addition to data analyst toolbox.
Resources
- :memo: DuckDB: an Embeddable Analytical Database – Link
- :memo: AWS Redshift documentation – Link
- :video_camera: DuckDB – The SQLite for Analytics – Link
Discover more from Shekhar Gulati
Subscribe to get the latest posts sent to your email.

Is there any possibility that DuckDB can be made into SQLite standard release as an option when creating the DB?
Thanks man, great write-up. I’m not an expert in database technologies, but you managed to make it really clear.
DuckDB is great! I also develop a FDW for DuckDB, https://github.com/alitrack/duckdb_fdw, and btw, would mind I translate your article to Chinese and publish it? thanks in advance.
Sure Ali. Please share the link once you have written the post. I will add to my blog.
Here is the Chinese translation link, https://mp.weixin.qq.com/s/NXHz3hoynrpjCB7lgJvOKg