If you have ever worked on a distributed application you will know that it is difficult to debug when things go wrong. The two common tools to figure out root cause of the problem are logging and metrics. But the fact of the matter is that logs and metrics fail to give us complete picture of a situation in a distributed system. They fail to tell us the complete story.
If you are building a system using Microservices / Serverless architecture then you are building a distributed system.
Logs fail to give us the complete picture of a request because they are scattered across a number log files and it is difficult to link them together to form a shared context. Metrics can tell you that your service is having high response time but it will not be able to help you easily identify the root cause.
Logging and Metrics are not enough to build observable systems.
Observability is a measure of how well internal states of a system can be inferred from knowledge of its external outputs. It helps bring visibility into systems. – Wikipedia
Logs, metrics, and traces are the three pillars of observability. While most software teams use logging and monitoring few of them use traces. Before we look at distributed tracing in depth, let’s define logs, metrics, and traces.
Logs, Metrics, and Traces
- Logs: A log is an immutable, timestamped record of event that happened over time. Logs are useful in context of a single application. In a distributed systems failures are triggered not by a single event but by many interconnected events happened across different components. To debug a problem in a distributed system, logs alone are not adequate. Tools in this space include ELK, Splunk, Fluentd.
-
Metrics – This is the actionable high-level numeric data exposed by most monitoring tools. Monitoring systems collect and record data over time to expose high-level metrics. Metrics are useful to determine overall health of a distributed system. Examples include memory and CPU consumption of the system, application uptime, request per second, application latency, errors, etc. Alerting systems rely on these metrics to alert operations team in case things go wrong. Like logs, metrics are useful in context of a single application. They fail to provide sufficient information to understand the lifetime of a request in a distributed system. It is difficult to correlate metrics across different services in a distributed system. Tools in this space include Statsd, Prometheus, Grafana.
-
Trace – A trace is a series of events with causal ordering that help understand request lifetime through a distributed system. They help us understand which event happened before a particular event so that we can build complete story of a transaction.
> Traces are used to identify the amount of work done at each layer while preserving causality by using happens-before semantics. – Cindy Sridharan
The diagram below shows that in a Microservices based application a request cross multiple processes. To ensure we can track a request across multiple processes we need to use some sort of identifier that will tie all the sub-requests together.

Distributed tracing
There is difference between the term distributed trace and distributed tracing.
Distributed traces are just structs.
Distributed tracing is the art and science of making distributed traces valuable.
Distributed tracing has two parts:
- Code instrumentation: This involves adding instrumentation code in your application to produce traces.
- This involves collection of data and providing meaning over it. They also provide visualisation tools to easily understand request lifetime.
Distributed tracing help tell stories of transactions that cross process boundaries.
We can use distributed tracing for following:
- Distributed transaction monitoring
- Root cause analysis
- Performance and latency optimisation
- Service dependency analysis
Most modern distributed tracing systems are inspired by Dapper. Google published Dapper paper in 2010. Dapper is an internal tool developed at Google to solve distributed tracing problem.
Most distributed tracing tools use dependency graphs and Gantt charts to visualise the request flow as shown in the image below.
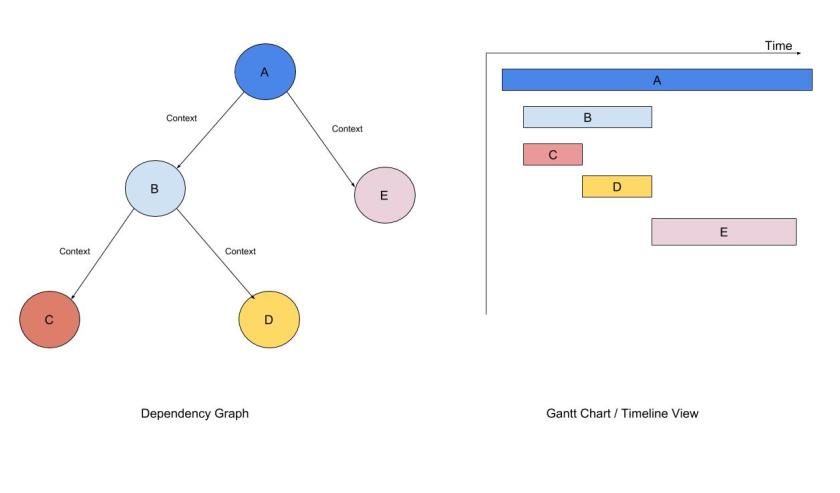
The key idea in distributed tracing is of context propagation. This is magic that links different sub-requests to give complete request view.
OpenTracing
OpenTracing is a vendor neural, open standard for distributed tracing. It is a specification that standardise how to instrument code for doing distributed tracing. It provides a model/interface for instrumentation. This gives developers the freedom to swap out the visualisation vendor. It is an open source project supported by CNCF (Cloud Native Computing Foundation). OpenTracing API libraries are available for many languages.
OpenTracing defines a specification that different open source or commercial projects implements. The most popular of them is Jaeger. It is is an open source tracing system created by Uber. In OpenTracing terminology these are called Tracers. Jaeger enables developers to visualise OpenTracing data.
The key terms in OpenTracing are:
- Trace: A recording of a transaction as it moves through a distributed system.
- Span: A named, timed operation representing a piece of the workflow. Spans have a timestamp, duration, and are annotated with tags and logs.
- Span Context: It is a set of trace identifiers injected into each request, which the next service will extract and use in order to propagate the trace.
A trace can be thought of as a directed acyclic graph (DAG) of spans.
OpenTracing in Action
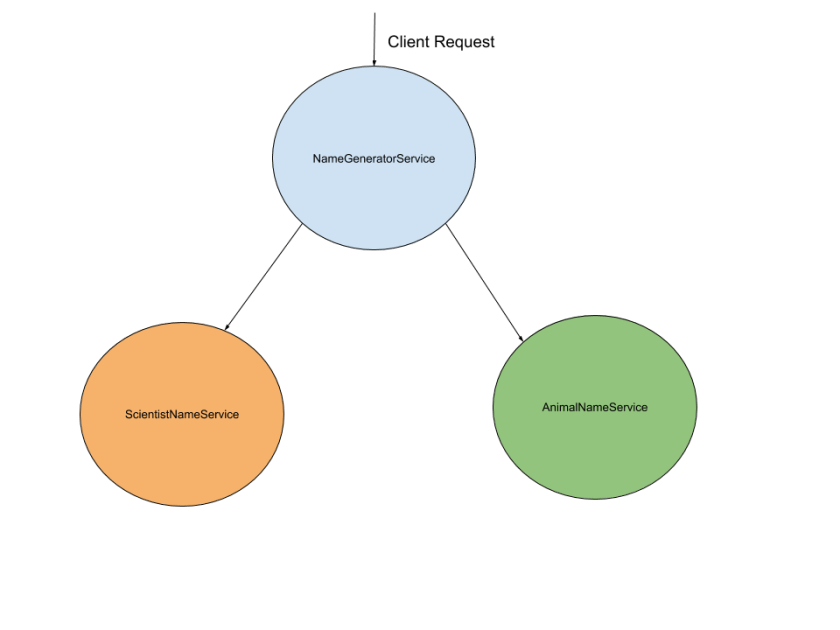
To show OpenTracing in action, we will build a simple contrived Microservices example application. The example application will generate names by concatenating famous scientists name with animal names. The example application is built using Spring Boot. We will have three Microservices as shown below in the diagram.
We will be using Jaeger as our tracer implementation. To run Jaeger on your machine, the easiest way is to use Docker as shown below.
docker run -p5775:5775/udp -p6831:6831/udp -p6832:6832/udp -p16686:16686 jaegertracing/all-in-one:latest --log-level=debug
The port 5775,6835,6832 are used for collecting metrics. The port 16686 is used for accessing the Jaeger dashboard.
You can view the Jaeger dashboard by visiting http://localhost:16686 in your favourite web browser.
Let’s quickly build our three Microservices using spring CLI.
spring init --dependencies=web name-generator-service
spring init --dependencies=web scientist-name-service
spring init --dependencies=web animal-name-service
This will create Spring Boot skeleton projects.
Now, we will create three Microservices.
ScientistNameService:
package com.shekhargulati.sns;

import org.springframework.boot.SpringApplication;
import org.springframework.boot.autoconfigure.SpringBootApplication;
import org.springframework.core.io.ClassPathResource;
import org.springframework.web.bind.annotation.GetMapping;
import org.springframework.web.bind.annotation.RequestMapping;
import org.springframework.web.bind.annotation.RestController;

import java.io.BufferedReader;
import java.io.IOException;
import java.io.InputStream;
import java.io.InputStreamReader;
import java.util.List;
import java.util.Random;
import java.util.stream.Collectors;

@SpringBootApplication
public class ScientistNameService {

    public static void main(String[] args) {
        SpringApplication.run(ScientistNameService.class, args);
    }

}


@RestController
@RequestMapping("/api/v1/scientists")
class ScientistNameResource {

    private final List<String> scientistsNames;
    private Random random;

    public ScientistNameResource() throws IOException {
        InputStream inputStream = new ClassPathResource("/scientists.txt").getInputStream();
        try(BufferedReader reader = new BufferedReader(new InputStreamReader(inputStream))){
            scientistsNames = reader.lines().collect(Collectors.toList());
        }
        random = new Random();
    }

    @GetMapping(path = "/random")
    public String name() {
        return scientistsNames.get(random.nextInt(scientistsNames.size()));
    }
}
AnimalNameService:
package com.shekhargulati.ans;

import org.springframework.boot.SpringApplication;
import org.springframework.boot.autoconfigure.SpringBootApplication;
import org.springframework.core.io.ClassPathResource;
import org.springframework.web.bind.annotation.GetMapping;
import org.springframework.web.bind.annotation.RequestMapping;
import org.springframework.web.bind.annotation.RestController;

import java.io.BufferedReader;
import java.io.IOException;
import java.io.InputStream;
import java.io.InputStreamReader;
import java.util.List;
import java.util.Random;
import java.util.stream.Collectors;

@SpringBootApplication
public class AnimalNameService {

    public static void main(String[] args) {
        SpringApplication.run(AnimalNameService.class, args);
    }

}

@RestController
@RequestMapping("/api/v1/animals")
class AnimalNameResource {

    private final List<String> animalNames;
    private Random random;

    public AnimalNameResource() throws IOException {
        InputStream inputStream = new ClassPathResource("/animals.txt").getInputStream();
        try(BufferedReader reader = new BufferedReader(new InputStreamReader(inputStream))){
            animalNames = reader.lines().collect(Collectors.toList());
        }
        random = new Random();
    }

    @GetMapping(path = "/random")
    public String name() {
        return animalNames.get(random.nextInt(animalNames.size()));
    }
}
NameGeneratorService:
package com.shekhargulati.ngs;

import okhttp3.OkHttpClient;
import okhttp3.Request;
import okhttp3.Response;
import org.springframework.boot.SpringApplication;
import org.springframework.boot.autoconfigure.SpringBootApplication;
import org.springframework.web.bind.annotation.GetMapping;
import org.springframework.web.bind.annotation.RequestMapping;
import org.springframework.web.bind.annotation.RestController;

import java.io.IOException;

import static strman.Strman.toKebabCase;

@SpringBootApplication
public class NameGeneratorService {

    public static void main(String[] args) {
        SpringApplication.run(NameGeneratorService.class, args);
    }

}

@RestController
@RequestMapping("/api/v1/names")
class NameResource {

    OkHttpClient client = new OkHttpClient();


    @GetMapping(path = "/random")
    public String name() throws Exception {
        String scientist = makeRequest("http://localhost:8090/api/v1/scientists/random");
        String animal = makeRequest("http://localhost:9000/api/v1/animals/random");
        return toKebabCase(scientist) + "-" + toKebabCase(animal);
    }

    private String makeRequest(String url) throws IOException {
        Request request = new Request.Builder()
                .url(url)
                .build();

        try (Response response = client.newCall(request).execute()) {
            return response.body().string();
        }
    }

}
You can run all of three services. NameGeneratorService runs on port 8080, ScientistNameService run on port 8090, and AnimalNameService run on port 9000.
Once running you can make cURL request and you will see random names.
curl http://localhost:8080/api/v1/names/random
john-cockcroft-snapping-turtle
Let’s add traces to NameGeneratorService.
We will start by adding dependency to jaeger-client.
<dependency>
  <groupId>io.jaegertracing</groupId>
  <artifactId>jaeger-client</artifactId>
  <version>0.34.0</version>
</dependency>
Next, we will create a bean of JaegerTracer as show below.
@Bean
public Tracer tracer() {
    SamplerConfiguration samplerConfig = SamplerConfiguration.fromEnv()
            .withType(ConstSampler.TYPE)
            .withParam(1);

    ReporterConfiguration reporterConfig = ReporterConfiguration.fromEnv()
            .withLogSpans(true);

    Configuration config = new Configuration("name-generator-service")
            .withSampler(samplerConfig)
            .withReporter(reporterConfig);

    return config.getTracer();
}
Now, we will add trace to the API method.
@GetMapping(path = "/random")
public String name() throws Exception {

    Span span = tracer.buildSpan("generate-name").start();

    Span scientistSpan = tracer.buildSpan("scientist-name-service").asChildOf(span).start();
    String scientist = makeRequest("http://localhost:8090/api/v1/scientists/random");
    scientistSpan.finish();

    Span animalSpan = tracer.buildSpan("animal-name-service").asChildOf(span).start();
    String animal = makeRequest("http://localhost:9000/api/v1/animals/random");
    animalSpan.finish();

    String name = toKebabCase(scientist) + "-" + toKebabCase(animal);
    span.finish();
    return name;
}
Restart the application. Make the cURL request again and you will see traces recorded by Jaeger.
curl http://localhost:8080/api/v1/names/random
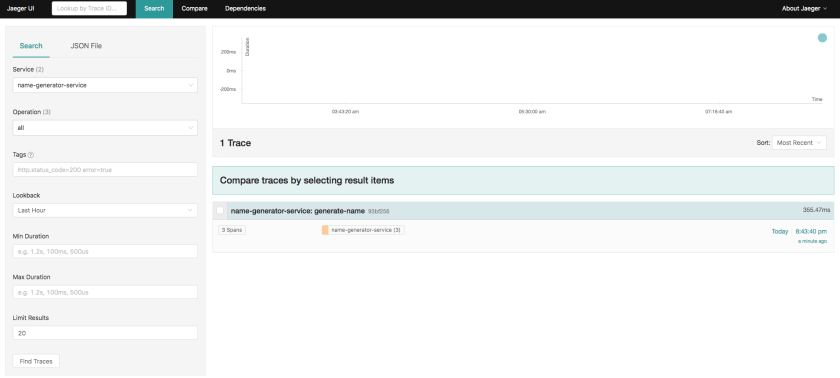
When you click on the trace, you will see more detailed information.

Inter-process context propagation
One thing that is missing in this is how we can propagate the context from name-generator-service Microservice to scientist-name-service and animal-name-service Microservices.
We will be passing context information in the header. To do that, we will make following changes to the NameGeneratorService as shown below.
<br />@RestController
@RequestMapping("/api/v1/names")
class NameResource {

    OkHttpClient client = new OkHttpClient();

    @Autowired
    private Tracer tracer;

    @GetMapping(path = "/random")
    public String name() throws Exception {

        Scope span = tracer.buildSpan("generate-name").startActive(true);

        Span scientistSpan = tracer.buildSpan("scientist-name-service").asChildOf(span.span()).start();
        String scientist = makeRequest("http://localhost:8090/api/v1/scientists/random");
        scientistSpan.finish();

        Span animalSpan = tracer.buildSpan("animal-name-service").asChildOf(span.span()).start();
        String animal = makeRequest("http://localhost:9000/api/v1/animals/random");
        animalSpan.finish();

        String name = toKebabCase(scientist) + "-" + toKebabCase(animal);
        span.close();
        return name;
    }

    private String makeRequest(String url) throws IOException {
        Request.Builder requestBuilder = new Request.Builder()
                .url(url);

        tracer.inject(
                tracer.activeSpan().context(),
                Format.Builtin.HTTP_HEADERS,
                new RequestBuilderCarrier(requestBuilder)

        );

        Request request = requestBuilder
                .build();

        try (Response response = client.newCall(request).execute()) {
            return response.body().string();
        }
    }


}
Next, we will update ScientistNameService to extract context information from headers.
@RestController
@RequestMapping("/api/v1/scientists")
class ScientistNameResource {

    private final List<String> scientistsNames;
    private Random random;
    @Autowired
    private Tracer tracer;

    public ScientistNameResource() throws IOException {
        InputStream inputStream = new ClassPathResource("/scientists.txt").getInputStream();
        try (BufferedReader reader = new BufferedReader(new InputStreamReader(inputStream))) {
            scientistsNames = reader.lines().collect(Collectors.toList());
        }
        random = new Random();
    }

    @GetMapping(path = "/random")
    public String name(@RequestHeader HttpHeaders headers) {
        SpanContext parentContext = tracer.extract(Format.Builtin.HTTP_HEADERS, new TextMapExtractAdapter(headers.toSingleValueMap()));
        Span span = tracer.buildSpan("find-random-scientist-name").asChildOf(parentContext).start();
        String name = scientistsNames.get(random.nextInt(scientistsNames.size()));
        span.finish();
        return name;
    }
}
Similarly, we will update AnimalNameService to extract context information from headers.
@RestController
@RequestMapping("/api/v1/animals")
class AnimalNameResource {

    private final List<String> animalNames;
    private Random random;
    @Autowired
    private Tracer tracer;


    public AnimalNameResource() throws IOException {
        InputStream inputStream = new ClassPathResource("/animals.txt").getInputStream();
        try(BufferedReader reader = new BufferedReader(new InputStreamReader(inputStream))){
            animalNames = reader.lines().collect(Collectors.toList());
        }
        random = new Random();
    }

    @GetMapping(path = "/random")
    public String name(@RequestHeader HttpHeaders headers) {
        SpanContext parentContext = tracer.extract(Format.Builtin.HTTP_HEADERS, new TextMapExtractAdapter(headers.toSingleValueMap()));
        Span span = tracer.buildSpan("find-random-animal-name").asChildOf(parentContext).start();
        String name = animalNames.get(random.nextInt(animalNames.size()));
        span.finish();
        return name;
    }
}
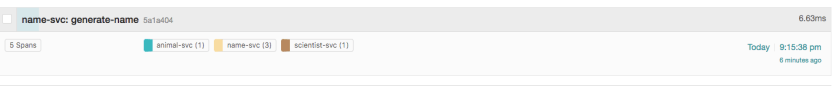
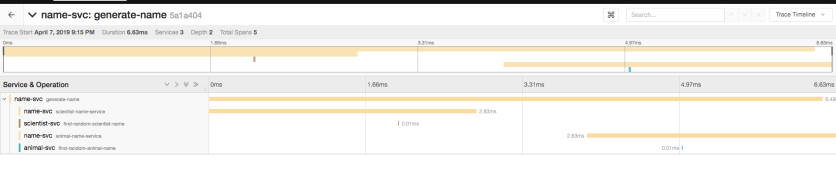
Restart all the applications and make cURL request to the name-generator-service. This time you will see scientist-name-service and animal-name-service in the name-generator-servicecontext as shown in below image.
Resources
- Video: Understanding Microservices with Distributed Tracing by Lita Cho- Link
- Video: Distributed Tracing: From Theory to Practice by Stella Cotton – Link
- Paper: Dapper, a Large-Scale Distributed Systems Tracing Infrastructure – Link
- Book: Distributed Systems Observability – A Guide to Building Robust Systems – Link
- Jaeger – Link
- Github repository: shekhargulati/opentracing-microservices-example – Link
Discover more from Shekhar Gulati
Subscribe to get the latest posts sent to your email.

Nice Article
Shekhar: Excellent! I respect them who can put theories in practice – you are one of them. Thanks Tanmay